For any business owner that wants to stay ahead of the competition, it is essential to track user experience (UX) metrics. These metrics provide valuable insights into how your customers interact with your website and what changes can be made to best optimize the user experience. From bounce rate to click-through rate, there are a variety of UX metrics you should consider tracking in order to ensure that your website meets the needs of its users.
Unraveling the 10 most essential UX metrics to monitor on your website is vital for understanding how you can effectively increase consumer satisfaction and engagement. By identifying these key performance indicators, you will be equipped with the knowledge to make smarter decisions about ways in which you can enhance user experience.
Sounds compelling, right? We’ll discuss our 10 metrics in just a second. First, let’s define UX to ensure we’re all on the same page.
What is User Experience (UX)?
UX metrics measure how users interact with a website. They provide insights into the usability, effectiveness, and overall satisfaction of a website's design. From page views to time on site, UX metrics are essential for understanding how your customers are using it and what changes can be made to optimize it.
By tracking these metrics, you will be able to identify areas of improvement. Not to mention, optimizing user experience can lead to higher conversion rates, increased customer satisfaction, and a stronger brand presence.
10 UX Metrics To Track for Greater Website Success
To ensure a positive user experience for all who visit your site, paying mind to the following UX metrics will be essential for success.
1. Bounce Rate

Image source: Unsplash
A site's bounce rate measures the percentage of visitors who leave your website without viewing any other page on the site. It is an indication of how effective your landing page is in engaging users and encouraging them to browse through your website. It also provides insight into how well your website communicates its purpose and value.
2. Time on Page
Time on page is the amount of time a visitor spends viewing one page of your website. With this metric, you can gain a greater understanding of the captivating power of your content and exactly how successful your website is at holding viewers' attention. You can often find this data collected in analytics platforms and use it to determine whether or not your content is effective
A worthwhile note: if the time on page metric coincides with a high subsequent bounce rate, it could point to an issue with your site's navigation. That is, visitors might be hunting around for information and ultimately leaving disappointed because they don't find it in a timely manner.
3. Click-Through Rate (CTR)

Image source: Unsplash
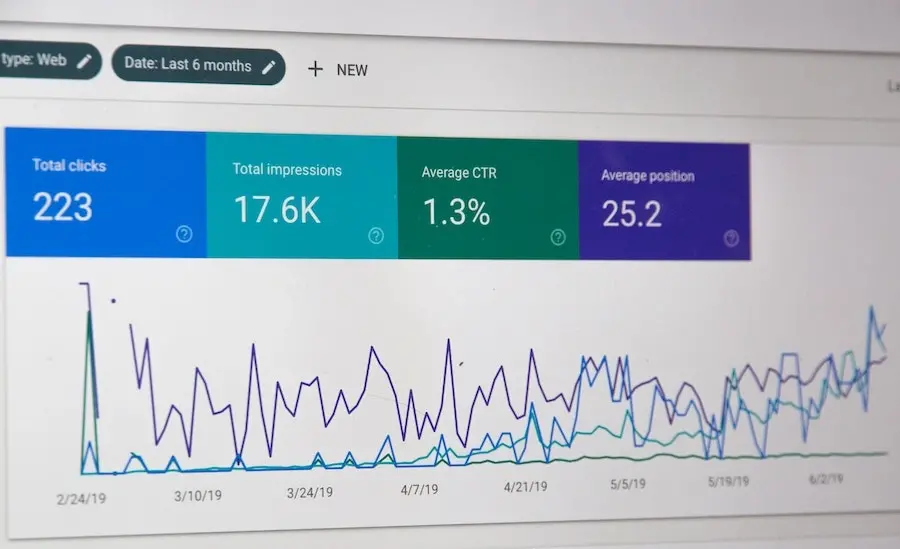
The click-through rate measures the number of visitors who click on a link on your website. It provides insight into how effective your marketing campaigns and content are at driving user engagement. It also indicates how effective your website is at encouraging visitors to take action.
This information is often collected using Google Analytics or other tracking software and can give you a sense of whether or not you need to change anything about your content.
4. Conversion Rate
This metric measures the number of visitors who take a desired action on your website such as subscribing to a newsletter or making a purchase. It is an indication of how effective your website is at achieving its desired goals and it's one of the most important metrics you can collect. After all, your conversion rate often directly coincides with the number of prospects and customers you have.
This metric does not measure how enjoyable a user’s experience was, but it does provide an indication of how successful your website is overall.
5. Page Views Per Session
Page views per session measure how many pages are viewed during one visit to your website. It helps you understand how engaging your website is and provides insights into what content is resonating with users. It's also generally an indicator of how long people are spending on your website.
Of course, it's important to note if an increased number of page views coincides with an increased bounce rate, as this could indicate issues with content relevancy or website navigation.
6. Customer Satisfaction

Image source: Unsplash
Customer satisfaction is a measure of how satisfied users are with the overall experience they had on your website. It is an indication of how successful you are at meeting user needs. This might sound a bit vague -- and honestly, it sometimes can be -- but it's still a useful UX metric to capture because good customer satisfaction can lead to repeat purchases, positive reviews and increased brand loyalty.
Typically, you can collect this data by asking customers to rate their experience on a scale of 1-5, but this can also be collected through other methods such as surveys and usability testing.
7. Return Visitor Rate
As you might suspect, this metric measures the percentage of visitors who return to your website multiple times. It is an indication of how successful you are at driving repeat visits and developing a loyal customer base. And it can also be a good indicator that your current UX is doing well and appealing to the overall sensibilities of your target audience.
8. Funnel Completion Rate

Image source: Unsplash
The percentage of visitors who complete a task or action on your website are those who complete the funnel and that's what this metric describes. It helps you understand what steps users are taking and if they are completing the desired task.
You can collect this information by using a combination of analytics and heat map tools and use it to make informed decisions about how you can drive user engagement and improve overall website performance.
9. Task Completion Rate
This metric measures the percentage of users who successfully complete a task on your website. It is an indication of how successful your website is at directing users to their desired goals. For example, if you want your users to sign up for a newsletter, this metric will measure how successful they are at doing so.
10. Interaction Rate
The interaction rate measures the number of interactions per visitor such as clicks, scrolls, and taps. It provides insight into how engaged users are with your website. This can be measured through heatmaps and A/B testing and can help you understand how users are interacting with different elements on your website.
By monitoring these UX metrics, you will be able to identify areas of improvement and optimize the user experience on your website. This will help you achieve greater website success and see better results.
How to Track UX Metrics
To track these UX metrics, you can use a variety of tools to collect and gain access to comprehensive data that can be analyzed to identify areas of improvement. Let's review a few of these tools now.
Google Analytics

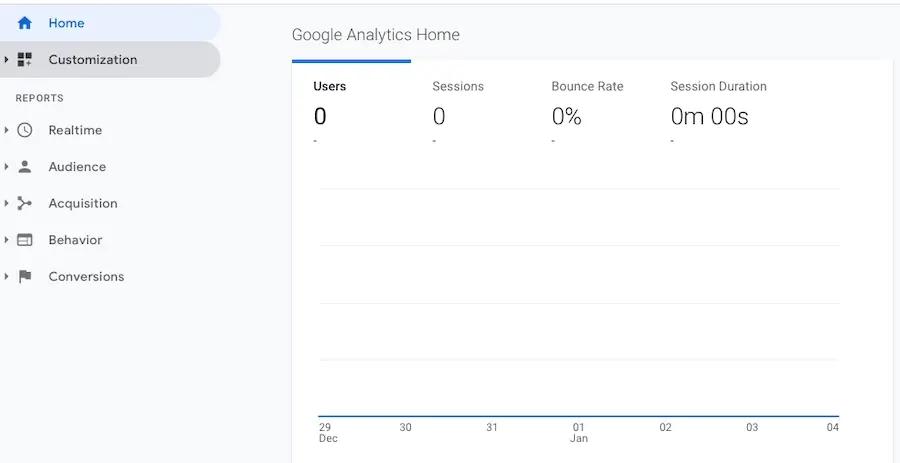
You can use Google Analytics to track website traffic, page views, bounce rate, and more. It provides you with easy access to user behavior data that can be used to improve the user experience on your website.
You can even use it to segment visitors, track conversion rate and optimize pages for better results.
Heat Maps

Heat maps are visual representations of where users click and scroll on a page. This can be used to identify what content works and help you adjust the design of your page accordingly. Hotjar and CrazyEgg are popular heat mapping tools that can be used to gain insights into user behavior.
These tools offer features like session recordings and funnel tracking that can help you gain a better understanding of user behavior on your website.
Surveys and Polls

Surveys and polls are a great way to directly ask users for their feedback on your website. Tools like SurveyMonkey and Typeform can be used to create surveys and polls for customers. This will provide you with direct feedback from users that can help you identify areas of improvement.
You could easily set up a survey that asks questions like the following to gain an understanding of user satisfaction:
- How satisfied are you with the overall experience on this website?
- How likely are you to recommend this website to a friend?
- What could be improved about this website?
By collecting data from these surveys and polls, you will gain a greater understanding of how users feel about your website as well as identify areas that could use improvement. And by asking specific questions, it can also aid in the development of strategies for optimizing UX and improving customer satisfaction overall.
Conduct User Testing

User testing offers the opportunity to identify any usability issues on your website and understand how users interact with it. Tools like UsabilityHub and UserTesting can be used to conduct user testing and gain insights into how people are using your website.
This method also makes it so you can get a better understanding of how users are navigating your website and if they are able to successfully complete tasks. This will help you identify any usability issues and fix them promptly.
A sample user test might look like this:
- Users are asked to navigate to a specific page on your website.
- Users are then asked to complete a task or action on the website.
- Users are asked to provide feedback on their experience and any issues they encountered.
With this data in hand, you can gain a better understanding of user behaviors and identify areas of improvement.
Use UX Metrics to Improve Your Site
Tracking UX metrics allows you to identify areas of improvement and optimize the user experience accordingly. If you use dedicated tools to conduct user testing, you will be able to collect data and insights into user behavior that can help you make informed decisions about how to optimize your website going forward.
So, the next time you're looking to enhance your website's user experience, make sure to consider tracking UX metrics. It could be the difference between a customer walking away satisfied or frustrated.
And if you're looking for a solid foundation for your site visitors to experience your content, consider one of our hosting plans for WordPress. Or, if that's not your jam, we offer cloud hosting plans as well, all of which prioritize site security and speed. No matter which routes you choose, your site's visitors will have a great experience, so you can check that off your to-do list, at least!
Frequently Asked Questions
Why should I create a website?
There are many reasons why you should create a website if you’re an artist. You can use it to create a place where people can learn about you, talk about your art, or show off your work.
How do I choose a design for my website?
One of the most important things when creating a website for your art is the design. Even though your pieces of art might be amazing, people will leave if your site is hard to navigate. This is why it’s important that the site is easy on the eyes and easy to navigate.
Can you migrate my existing website over?
Yes, and without issue. Regardless of how many websites you’re managing, we’ll bring all of them under the Verpex wing free of charge. Just send us the details of your websites when you’ve signed up to get started.
What is the best way to display my art on my website?
Your website can be used for many things; however, you need to keep in mind that you created your website to promote your art. Don’t get wrapped up in all the things around your site and forget to put the primary focus on your art.

Brenda Barron is a freelance writer and editor living in southern California. With over a decade of experience crafting prose for businesses of all sizes, she has a solid understanding of what it takes to capture a reader's attention.
View all posts by Brenda Barron


